Flapping never wakes you up
Alerts fire only after N consecutive failures, failed probes are retried before anything is recorded, and a database taking ten services down with it sends one notification - the root cause, with its blast radius.
Flapping never wakes you up
Alerts fire only after N consecutive failures, failed probes are retried before anything is recorded, and a database taking ten services down with it sends one notification - the root cause, with its blast radius.
One small binary
HTTP, TCP, ICMP, DNS and push probes, TLS expiry and key-pin checks, SQLite storage, a server-rendered status page, Prometheus metrics and ten notification backends - migrations and templates compiled in. The Docker image is a static musl binary on Alpine, about 15 MB.
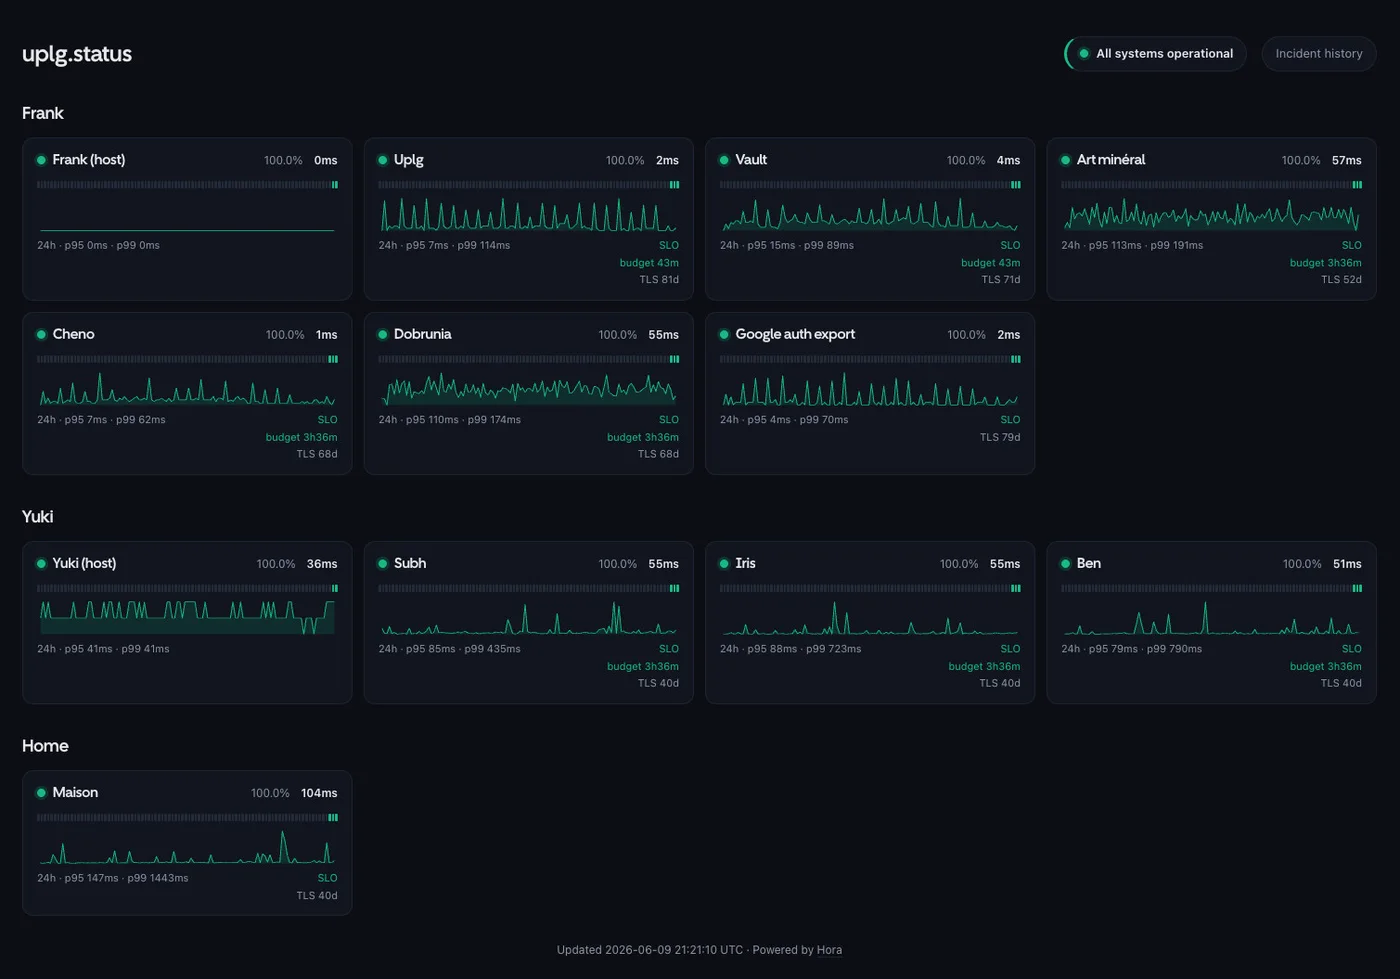
SRE-grade alerting
Availability SLOs with visible error budgets and Google-SRE multi-window burn-rate alerts: catch the slow-burning flapping a binary down alert never confirms - and stay quiet once the burn stops.
Built for operators
Live config reload without a blind window, ad-hoc silences for deploy hooks, incident annotations, failure snapshots (“what did the service actually answer?”), one-statement backups, and an Uptime Kuma importer.
depends_on and alerts are annotated “caused by X”
or “impacts: A, B, C”; dependent alerts fold into their root cause’s
single notification.curl it.Named after the Horai, the Greek goddesses of the hours.