

The status page
Hora serves its status page itself, at /, rendered on the server with no
JavaScript framework. It is the same page for your visitors and for you;
what changes is how much it shows.
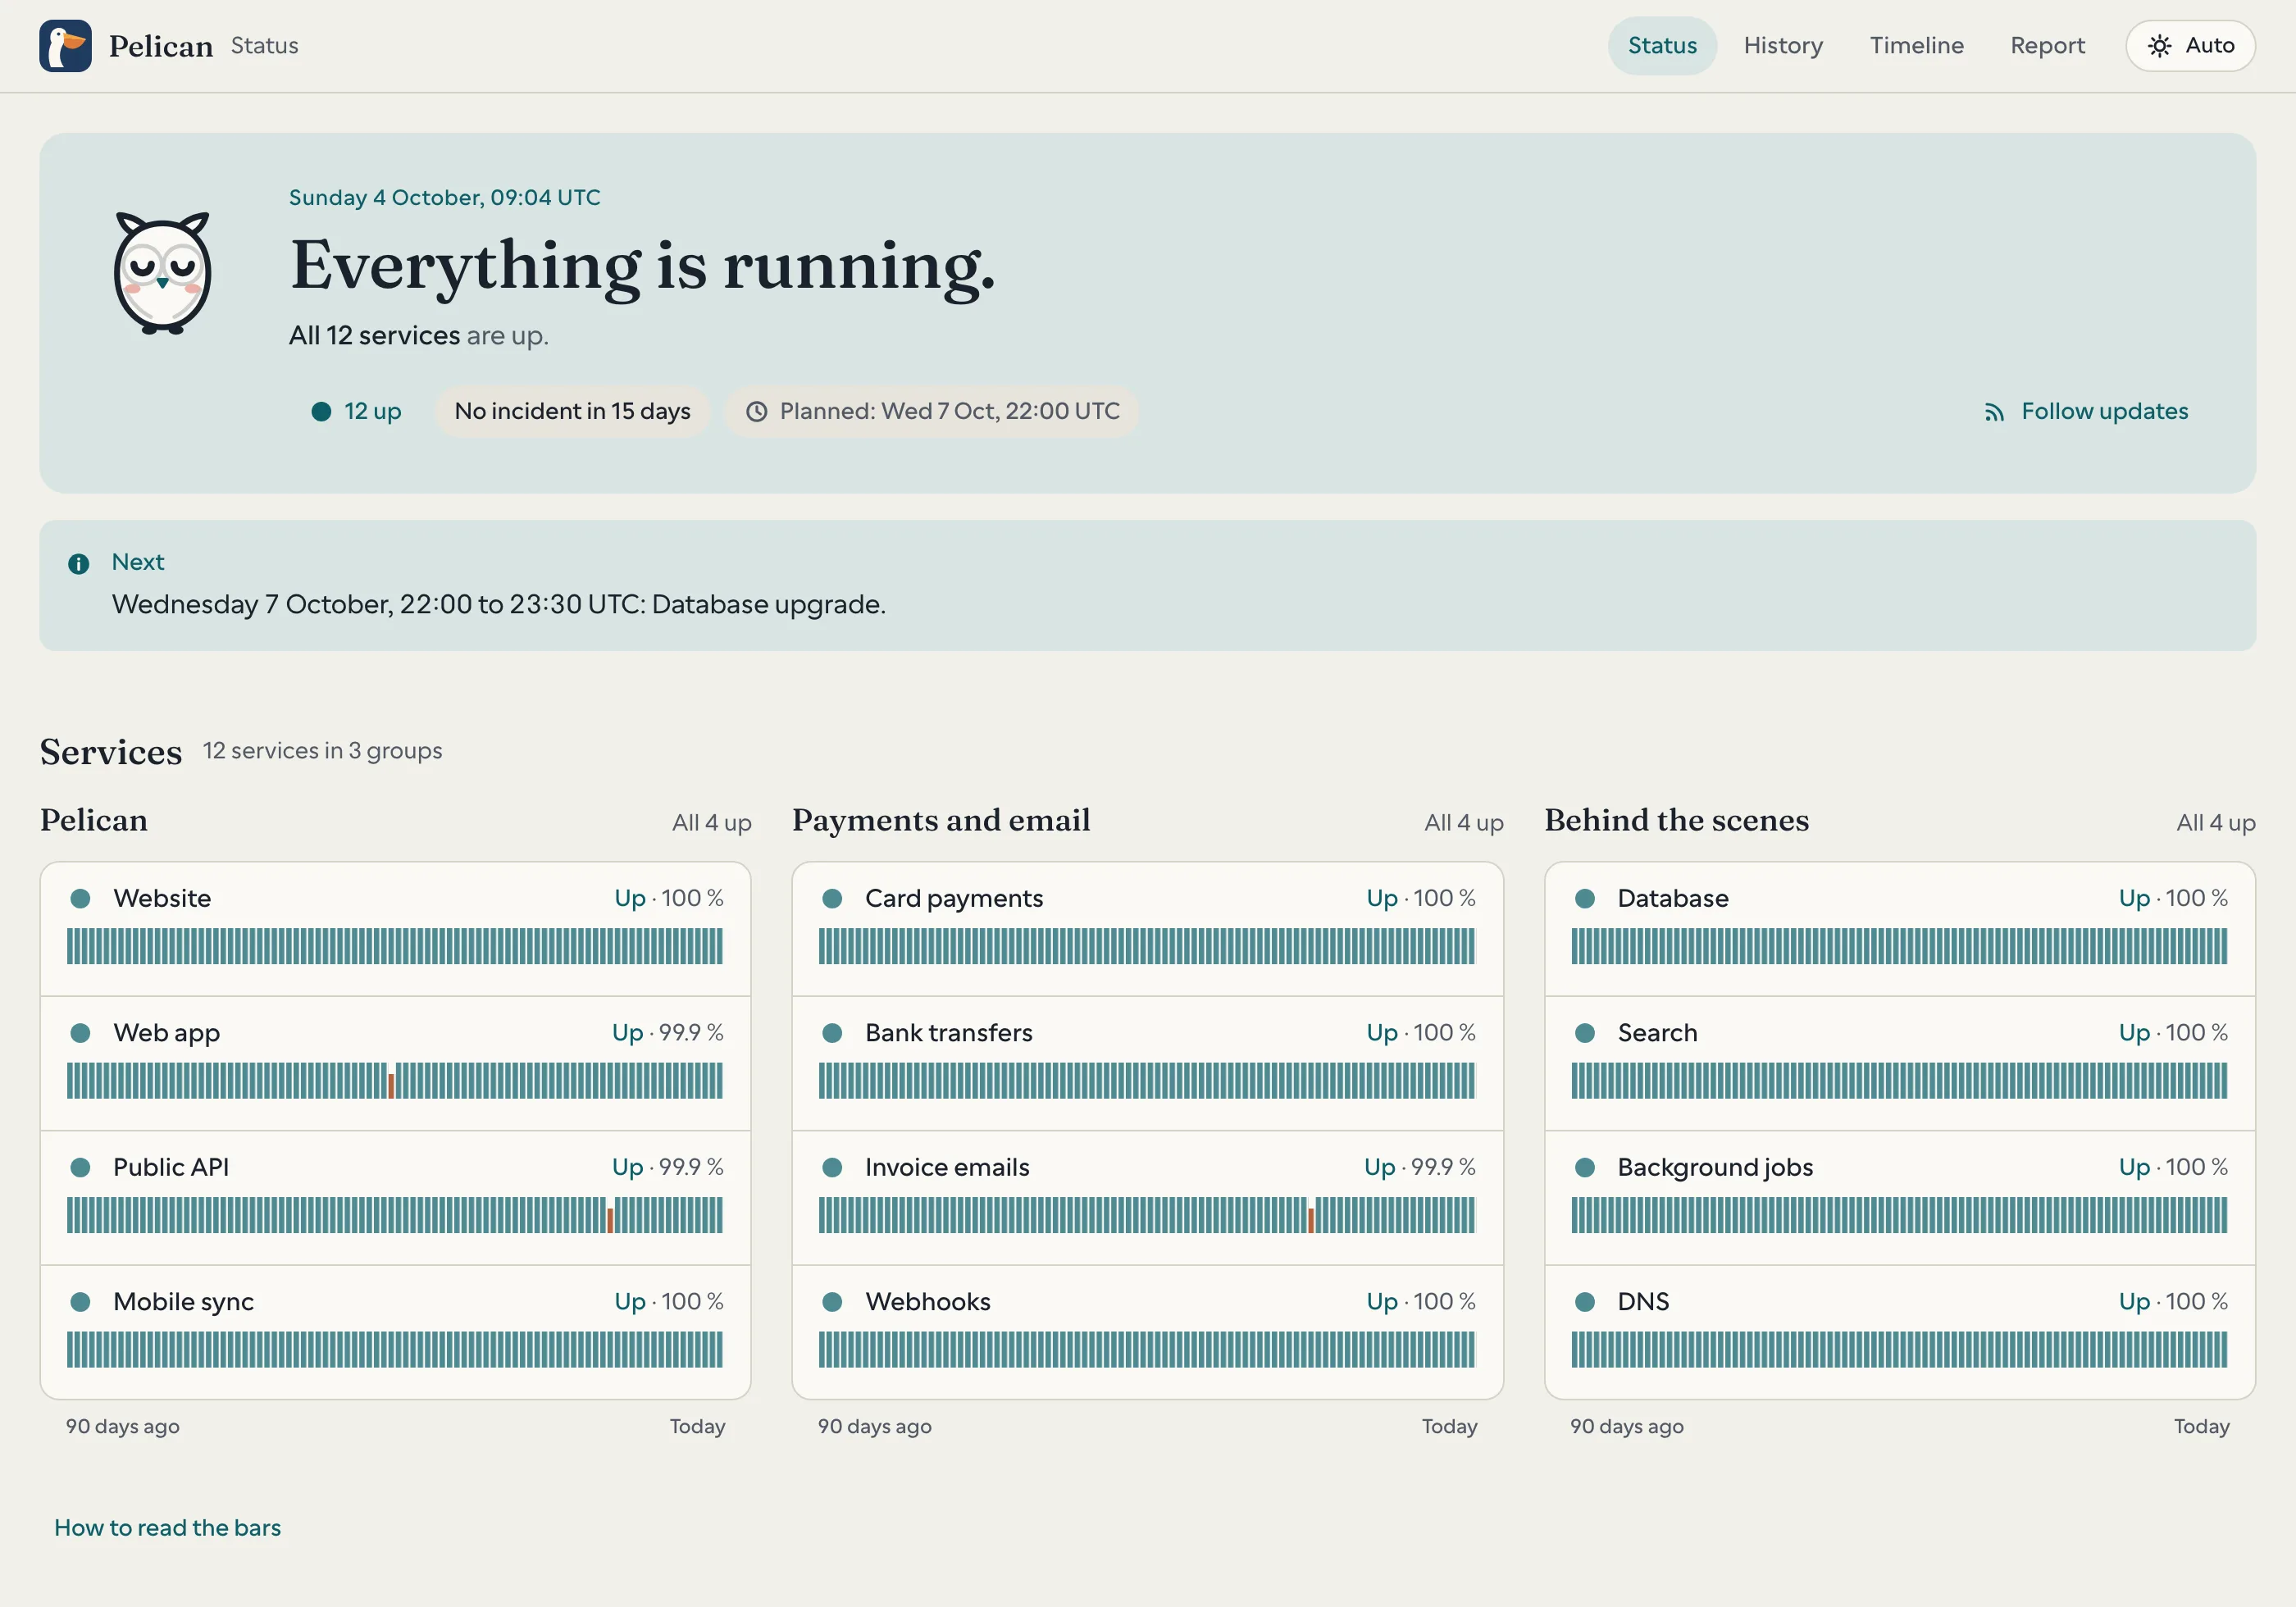
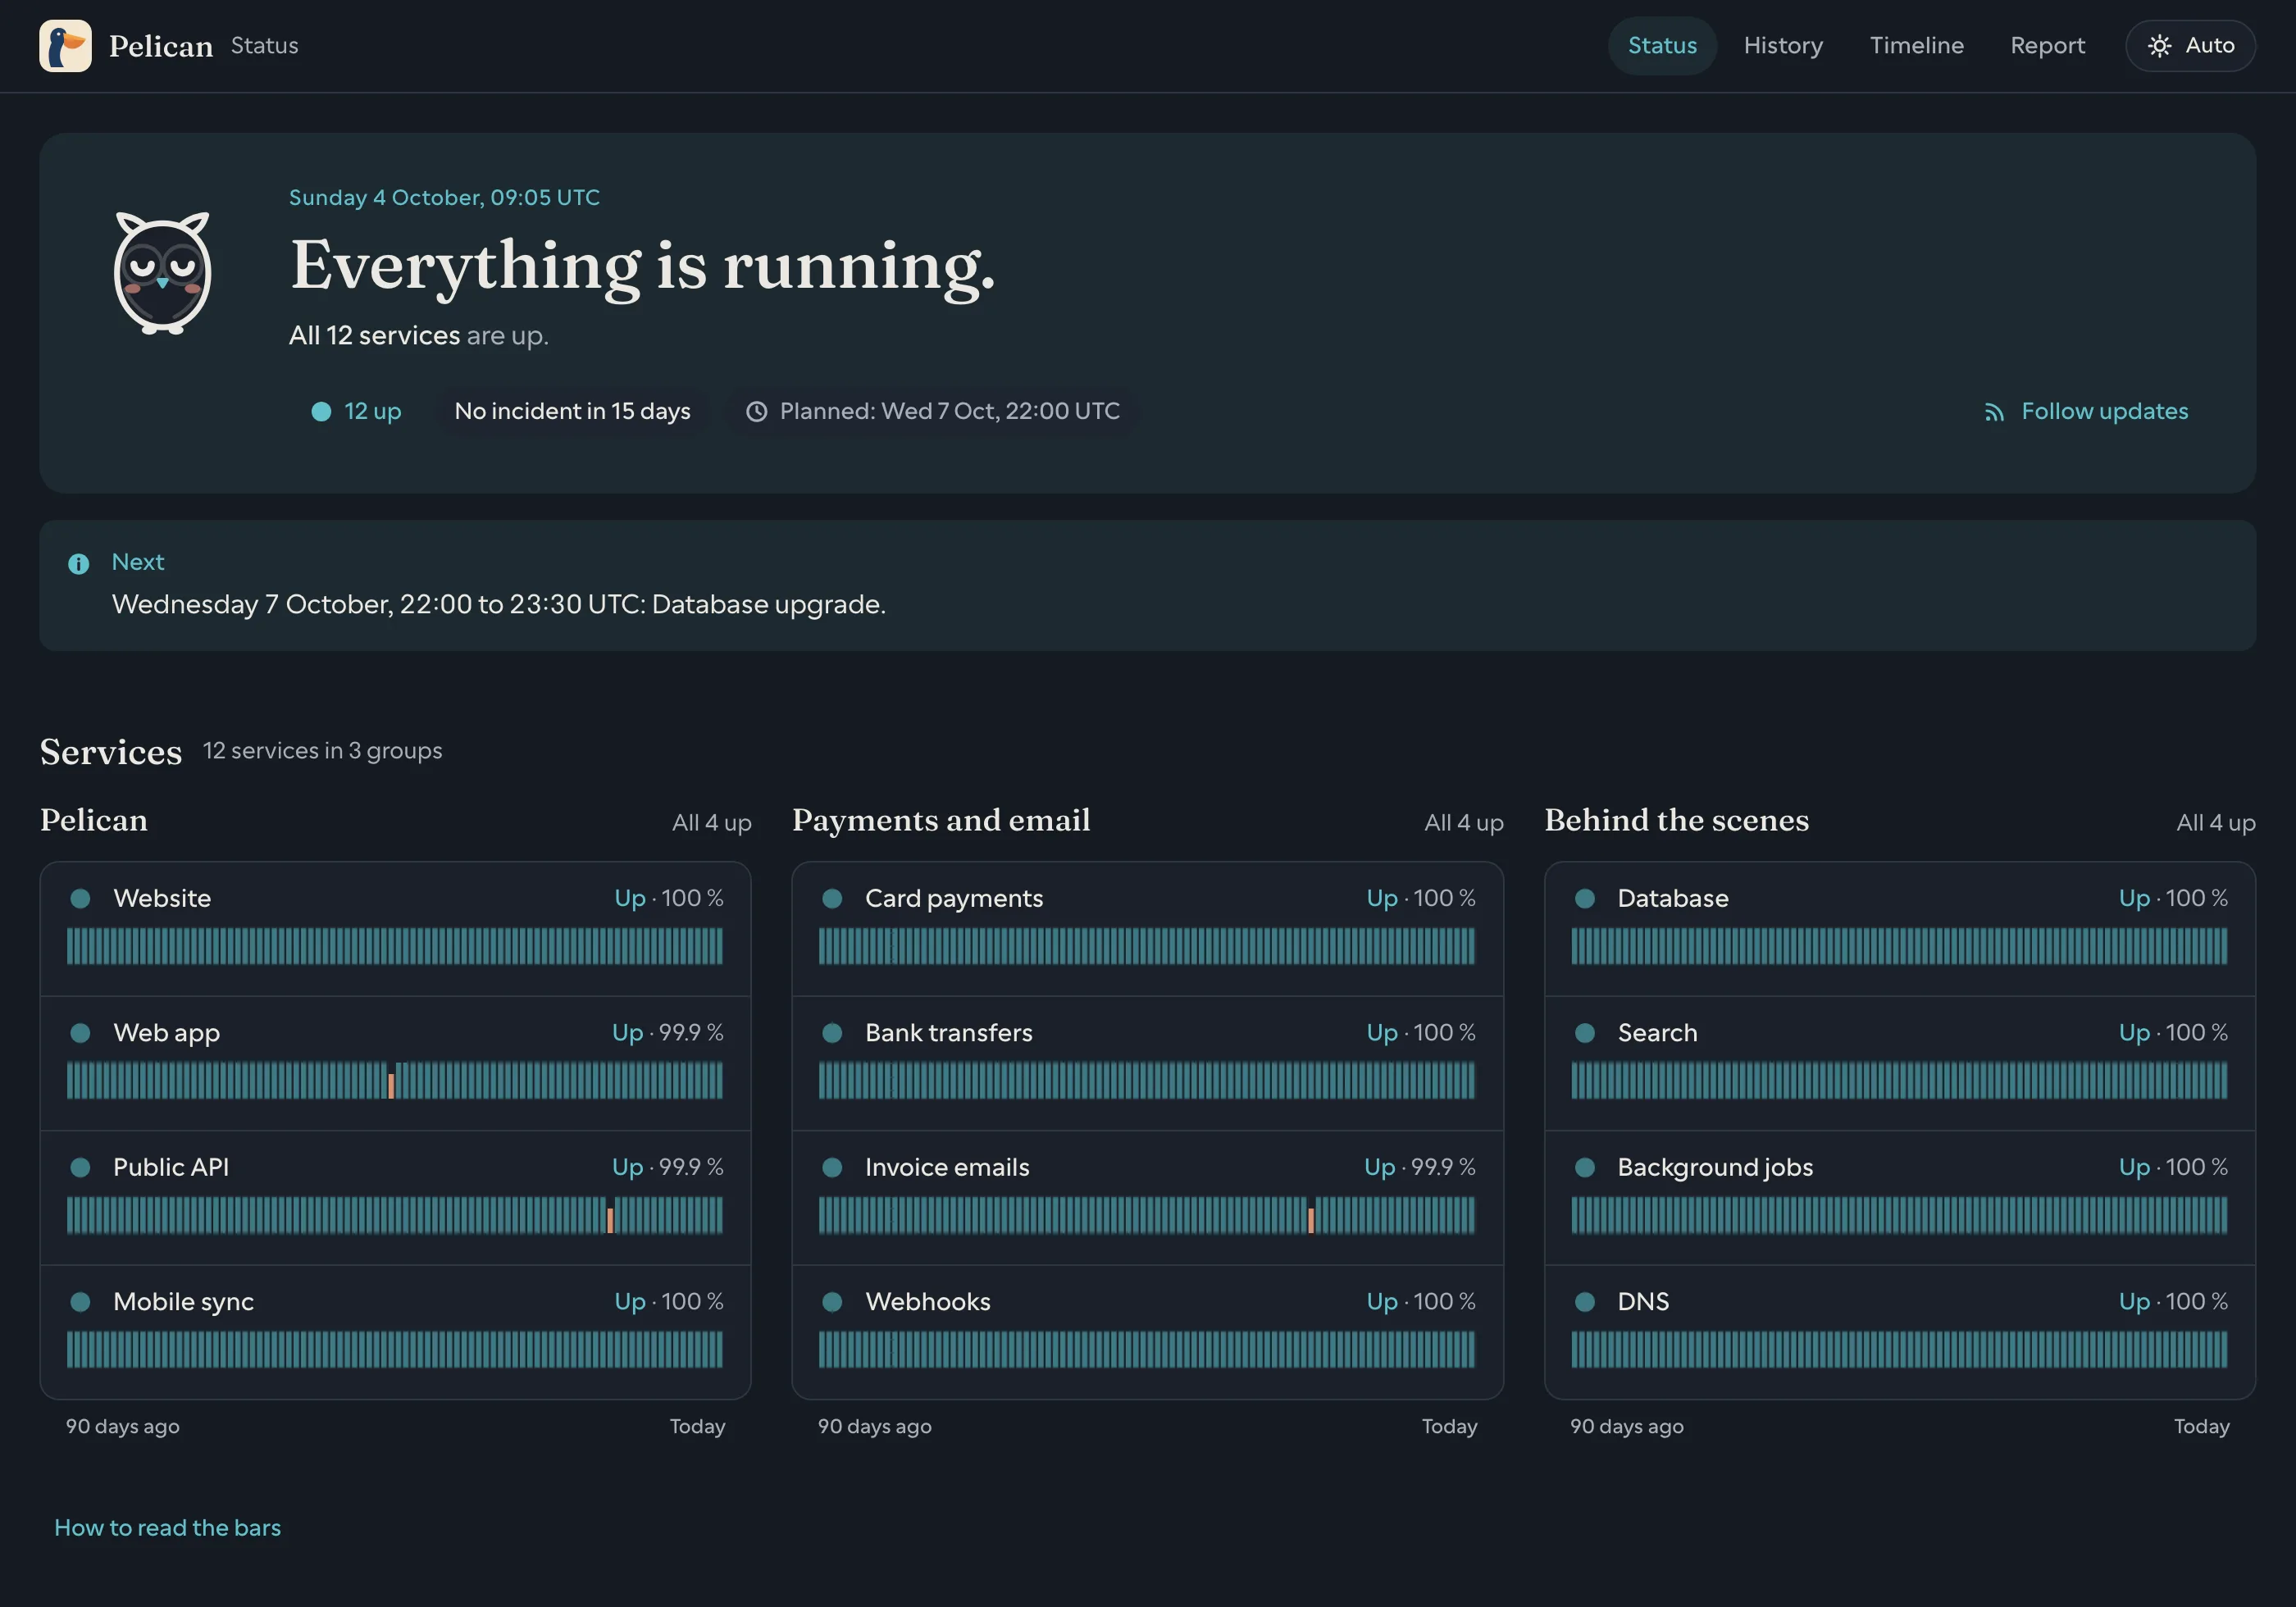
What visitors see
Section titled “What visitors see”A visitor without a token sees the public monitors (public = true, the
default) and nothing else, from the top:
- The hour and one sentence that answers “is it working?”: Everything is running., Card payments is down., Planned maintenance, until 23:30. The owl beside it takes the same state. Under it, a chip per count (12 up, 1 down), No incident in 15 days while nothing is down, and the next planned window, up to a week ahead.
- Announcements: banners you pinned with
hora announce,POST /api/announceor[[incidents]]in the config, newest first. See Announcements. - Maintenance: a window in progress, with how far along it is, and the monitors it covers.
- Needs attention: whatever is not plainly up, worst first, each with one line of why: Since 14:02 UTC (38 min). Last answer: HTTP 503., Answers take 1.8 s (usually 120 ms).
- Services, by group (
group = "..."): each with its state as a shape and a word, its uptime over the bar’s days, and a daily bar over[page] history_days(90 by default). Each row and bar opens the monitor’s own page. - Recent incidents: the last three, with the note you added to each
(
hora annotate), and a link to the whole history. - Who keeps watch: with peers, how many places check the services.
Every state has a shape, a word and a colour, so none relies on colour alone: up is a disc, Slow a half disc, Down a diamond, Maintenance a clock, No data a dashed ring. In the daily bar, a day’s height is part of its state too: up all day is full height, slow at times is shorter, an outage drops below the line, a day a maintenance window touched is half height (unless it still was an outage), and a day without data is a stub.
Root cause reads in the same line of why: Probably caused by Database. on a monitor down because of an upstream, Web app depends on it. on the upstream itself.
From several places: with peers, a down that only this
node sees, while every peer reaches the target, is a network problem near
this node, not an outage. The page shows the service as Up with a calm
Not an outage notice. The alert is flagged as seen from this node only,
and goes to alerts.notify_unconfirmed instead of the monitor’s channels
when that is set (see local-only downs). A down the peers confirm
says where it was seen from.
Failure reasons are reduced to a safe category for visitors (HTTP 500,
content check failed): the full reason can contain response bodies, DNS
answers or the keyword you assert on. A monitor opts into publishing the
full detail with public_error_detail = true.
At scale, past 30 monitors, the page stays light: groups where all is well fold into one row with the group’s bar, open on a click, and a group lists at most 24 services, problems first; Show all opens the group’s own page. On 700 monitors the page weighs about 70 kB.
Each monitor’s page
Section titled “Each monitor’s page”/monitor/{id} has the rest: the uptime over the bar’s days with its
outages (One outage, 41 min, on 18 Sep), the response time over 24 hours,
one link per day of the bar with what happened that day, the hour-by-hour
heatmap of the last four weeks, the places that check it, and its
incidents.
Theme and wall screens
Section titled “Theme and wall screens”The page follows the visitor’s light or dark setting. The button at the
top cycles Auto, Light and Dark; ?theme=light or ?theme=dark in
the link forces one (for an embed), and the choice follows the visitor
from page to page.
The page does not reload by itself. For a wall screen or a kiosk, add
?refresh=60 to the link: the page then reloads every 60 seconds (any
value from 10 to 3600; anything else is ignored) and says so at the top.
It reads well on a phone, and goes on its home screen as an app (Add to Home Screen): the owl as its icon, your page title as its name, opening on the live status page.
What you see
Section titled “What you see”With the operator token (server.auth_token), the same page also shows:
- Private monitors (
public = false). Without the token, a private monitor is absent everywhere: page, API, badges, history and feed. Its endpoints answer 404, exactly like an id that does not exist. - Full failure detail on every monitor, and the captured response of the last failure in the history.
- Why this is not an outage: for a down seen from this node only, who saw what, place by place, and where such a down goes with your config (the monitor’s channels, the quiet ones, or nowhere).
- The watched peers, with when each was last heard from, and the
Watchers page (
/watchers): this node’s view of its peers, the last 30 days of confirmations, each shared service from each place. - Event markers (
hora event "deploy api v2.3") as dashed lines on each monitor’s response-time chart. - Channel health in
/api/summaryandhora top.
The header says Operator while you are signed in. For a browser, the
simplest way to present the token is a link with ?token=... (read-only
views accept it); the links on the page carry it on. Keep that link
private; it ends up in browser history. Scripts should send
Authorization: Bearer instead (see
Authentication).
A group token sits in between: it reveals
everything about one group on /status/{group}, and nothing about the
others.
The read-only token (server.view_token) is the one for a wall display
or a colleague: it shows the private monitors and the full failure detail of
every monitor, like the operator token, but not the rest of this list (no
Why this is not an outage, peers, event markers or channel health), and no
write endpoint accepts it. A ?token= URL that leaks then shows a page; it
cannot mute an alert.
Other pages
Section titled “Other pages”| Page | What it shows |
|---|---|
/monitor/{id} |
One monitor: its figures, its days, where it is checked from, its incidents. |
/history |
Confirmed incidents, newest first, with their notes. See Incidents & history. |
/history.atom |
The same incidents as an Atom feed, to follow in a feed reader. |
/incident/{id} |
One incident as a post-mortem, with the markdown ready to copy. |
/timeline |
One chronology of the last 7 days: downs and recoveries, events, pushed alerts, announcements and silences. |
/status/{group} |
One group’s page. See Per-group pages. |
/report/{YYYY-MM} |
The printable monthly SLA report, with a strip of each service’s days. |
/watchers |
The operator’s view of the peers (operator only). |
Visitors see sanitized versions of each: public monitors only, safe failure categories, no event markers or silences.
In a terminal
Section titled “In a terminal”curl (or wget, or any client that asks for text/plain) gets an aligned
plain-text page instead of HTML, on / and on /status/{group}:
$ curl -s https://status.example.com/Pelican=======
Card payments is down. 6 of 8 services are up. One is down and one is slow; the rest is fine.Saturday 3 October, 14:40 UTC
Pelican-------  ● Website      Up            100.0 %     64 ms  ● Web app      Up             99.9 %     88 ms  ● Public API   Up             99.9 %    112 ms  ● Mobile sync  Up            100.0 %     71 ms
Payments and email------------------  ◆ Card payments   Down           97.3 %         -  ● Bank transfers  Up            100.0 %    210 ms  ◐ Invoice emails  Slow          100.0 %   1820 ms  ● Webhooks        Up            100.0 %     95 ms
Each line has the state’s shape and its word (● up, ◐ slow, ◆ down,
◷ maintenance, ◌ no data), the 24-hour uptime and the latest answer
time. A down seen from one place only reads Up, with a line under it
saying so.
For a live view that also acts (announce, silence), use
hora top.
Embedding and machines
Section titled “Embedding and machines”- Badges:
/api/badge/{id}/statusand/api/badge/{id}/uptimeare SVG badges for a README. See Badges. - JSON:
/api/summaryhas everything the page shows. - Prometheus:
/metrics.
Behind a reverse proxy
Section titled “Behind a reverse proxy”Hora serves plain HTTP and assumes nothing about its domain: put it behind Caddy, nginx or Cloudflare. Two settings matter there:
server.client_ip_header: every page is rate-limited per client IP. Without this setting, every visitor shares the proxy’s address and its bucket. Set it to the header your proxy writes (x-real-ip, orcf-connecting-ipbehind Cloudflare). Withx-forwarded-for, a list, Hora reads the entry your proxy appended (the last one); setserver.trusted_proxies = 2when two of your proxies append. See Rate limiting.- HSTS belongs to the proxy that terminates TLS.
Settings
Section titled “Settings”[page]title = "My services" # shown at the top and in the browser tabhistory_days = 90 # days in the uptime barlogo = "logo.svg" # beside the title, instead of its initiallogo_dark = "logo-dark.svg" # optional: the dark theme'sThe header shows the title beside a tile with its initial; logo puts
your own mark there instead, on every page and on the monthly report. It is
an SVG, PNG, WebP or JPEG file of 256 KiB at most, relative to the config
file (in Docker, /etc/hora/logo.svg next to the config). Hora reads it
with the config, so after replacing the image alone, save the config to
reload it.
If your mark needs other colours on a dark page, give that version as
logo_dark: the page shows the one of the theme in force, the visitor’s
system or the one they chose with the theme button (?theme=), and prints
the light one. Use two files rather than an SVG with its own
@media (prefers-color-scheme: dark) rules: an image follows the system,
never the theme button.
Per monitor: group, public, public_error_detail, depends_on (for
the cause and impact lines), slo_uptime (for the budget), and
degraded_over_ms.